Where Statistics Meet Community

Connect with passionate sports analytics enthusiasts across Canada. Explore data-driven discussions, share insights, and discover the vibrant world of sports statistics.

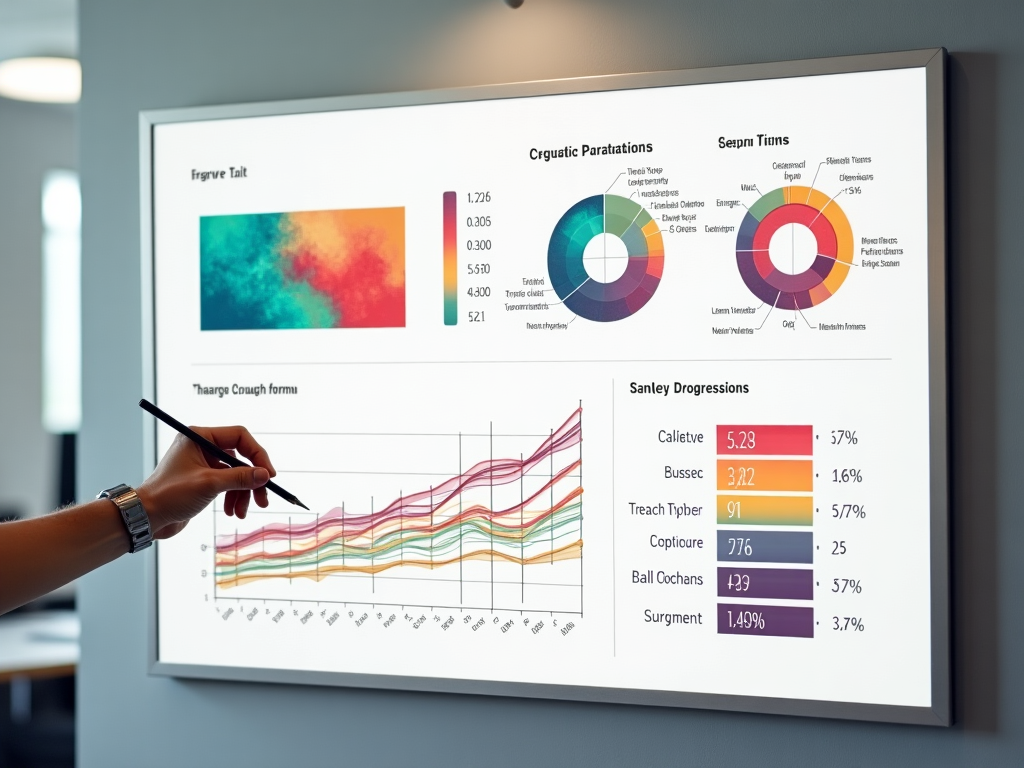
Sports statistics visualization dashboard

10,000+

Active Members

50+

Communities

1,000+

Data Resources

Your Gateway to Sports Analytics Communities

Mellowhike serves as a comprehensive directory and information hub for sports statistics enthusiasts in Canada and beyond. Whether you're a seasoned data analyst, a passionate sports fan, or someone just beginning to explore the fascinating world of sports analytics, our platform connects you with the right communities and resources.

The landscape of sports statistics has evolved dramatically over the past decade. What was once the domain of professional teams and broadcasters has become accessible to everyone. Today, countless communities exist where fans analyze player performance, predict game outcomes, create stunning visualizations, and engage in thoughtful discussions about the numbers behind the games we love.

Community discussion about sports statistics

Discover Thriving Communities

Connect with fellow enthusiasts across various platforms dedicated to sports statistics and analytics

Reddit Communities

Reddit hosts some of the most active and knowledgeable sports statistics communities. These subreddits offer daily discussions, original analysis, and a wealth of shared resources. Each community has its own culture and focus, from casual fan discussions to deep statistical dives.

r/soccer

The largest football community on Reddit with over 4 million members. Daily match threads feature extensive statistical analysis, expected goals (xG) discussions, and player performance metrics. Members share visualizations, debate tactical decisions using data, and analyze transfer market trends.

Football Global 4M+ Members

r/nba

Basketball statistics paradise with comprehensive player tracking data discussions. The community analyzes advanced metrics like PER, Win Shares, and VORP. Regular posts feature shot charts, efficiency ratings, and historical comparisons backed by decades of statistical data.

Basketball NBA 5M+ Members

r/hockey

Canada's favorite sport gets deep statistical treatment here. Discussions cover Corsi, Fenwick, expected goals, and zone entry data. The community is particularly strong in analyzing goaltender performance, power play efficiency, and playoff statistics.

Hockey NHL 1.5M+ Members

r/tennis

Tennis analytics community focusing on serve statistics, break point conversion rates, and surface-specific performance data. Members track ATP and WTA rankings, analyze Grand Slam statistics, and discuss the evolution of playing styles through data.

Tennis Grand Slams 400K+ Members

Discord Servers

Discord provides real-time communication channels perfect for live game analysis and instant statistical discussions. These servers often feature dedicated channels for different sports, statistical methodologies, and data visualization techniques. Voice channels allow for live commentary and collaborative analysis during games.

Real-Time Analysis

Join live discussions during games with instant statistical updates and analysis. Many servers have bot integrations that provide real-time statistics, player tracking data, and automated alerts for significant statistical events.

Specialized Channels

Find dedicated spaces for specific sports, statistical methods, and analytical approaches. Channels often include beginner-friendly spaces, advanced analytics discussions, data visualization showcases, and programming help for statistical analysis.

Learning Communities

Many Discord servers offer educational resources, tutorials, and mentorship opportunities. Experienced analysts share their knowledge about statistical software, data collection methods, and best practices for sports analytics.

Specialized Forums

Traditional forums remain valuable resources for in-depth, threaded discussions that can span months or years. These platforms excel at building comprehensive knowledge bases and maintaining detailed historical discussions.

BigSoccer

Established in 1995, BigSoccer is one of the oldest and most comprehensive soccer discussion forums. The statistics subforum features detailed match analysis, player performance tracking across seasons, and historical data comparisons. Members often create extensive databases and statistical projects.

InsideHoops

A basketball-focused forum with strong emphasis on statistical analysis and player comparisons. The community maintains historical statistical databases and engages in detailed discussions about advanced metrics, draft analysis, and team building strategies.

HFBoards

The premier hockey discussion forum with dedicated subforums for statistical analysis. Known for its rigorous approach to historical player comparisons, draft analysis, and advanced metrics discussions. The community includes many industry professionals and analysts.

Essential Resources for Sports Analytics

Comprehensive collection of platforms, tools, and communities for statistical analysis

Data analytics workspace

StatsBomb Community

StatsBomb has revolutionized football analytics by providing free, high-quality event data to the public. Their community forums and social media presence foster discussions about advanced metrics like expected goals (xG), expected assists (xA), and possession value. The platform offers educational resources, tutorials, and case studies that help both beginners and advanced analysts understand modern football analytics.

The StatsBomb community regularly publishes research papers, hosts webinars, and maintains an active presence on social media where analysts share insights and methodologies. Their open data project has enabled countless students, researchers, and enthusiasts to conduct meaningful statistical analysis without expensive data subscriptions.

Statistical Blogs and Publications

The sports analytics blogosphere has grown into a sophisticated ecosystem of independent analysts, data journalists, and researchers. These platforms offer deep dives into specific statistical questions, methodology discussions, and innovative analytical approaches.

Independent Analysts

Individual bloggers who specialize in specific sports or analytical methods. Many maintain detailed databases, create custom metrics, and share their code and methodologies openly. These blogs often serve as portfolios for aspiring sports analysts and provide valuable learning resources.

Medium Publications

Medium hosts numerous sports analytics publications featuring articles from multiple contributors. Topics range from beginner tutorials on basic statistics to advanced machine learning applications in sports. The platform's comment system facilitates meaningful discussions and peer review.

Data Journalism

Professional sports journalists increasingly incorporate statistical analysis into their reporting. Many maintain personal blogs alongside their official work, offering deeper statistical context and methodological explanations that complement their published articles.

Video Content and Channels

YouTube content creation setup

Video content has become increasingly important for communicating complex statistical concepts. These channels combine data visualization with narrative storytelling to make analytics accessible and engaging.

Tifo Football

Animated tactical and statistical analysis of football. Each video combines match footage with data visualization to explain tactical concepts, player performance, and team strategies. Their videos on expected goals, pressing systems, and player roles have helped popularize advanced metrics among casual fans.

By The Numbers

Deep statistical analysis across multiple sports with focus on methodology and data interpretation. Videos often include tutorials on statistical software, explanations of advanced metrics, and critical analysis of how statistics are used in sports media.

Secret Base

Long-form documentary content that incorporates statistical analysis into sports storytelling. Their series on statistical oddities, historical analysis, and "what if" scenarios demonstrate how data can enhance sports narratives.

Podcasts and Audio Content

Podcast recording session

Data Visualization Excellence

Discover creators who transform statistics into compelling visual stories

Infographic design process

Data visualization has become an art form in sports analytics. Skilled designers and analysts create infographics, interactive dashboards, and animated visualizations that make complex statistics accessible and engaging. These visual narratives help audiences understand patterns, trends, and insights that might be lost in raw numbers.

The best sports visualizations balance aesthetic appeal with statistical rigor. They choose appropriate chart types, use color effectively, and provide necessary context without overwhelming the viewer. Many visualization specialists share their work on social media platforms, creating portfolios that showcase different approaches to presenting sports data.

Types of Sports Visualizations

Performance Tracking

Line charts and area graphs that show player or team performance over time. These visualizations often include contextual information like injuries, coaching changes, or opponent strength to explain statistical trends.

Spatial Analysis

Heat maps, shot charts, and passing networks that show where events occur on the playing surface. These visualizations reveal tactical patterns and player tendencies that aren't apparent from aggregate statistics.

Comparative Analysis

Radar charts, scatter plots, and parallel coordinates that compare multiple players or teams across various metrics. These visualizations help identify similar players, evaluate trade targets, and understand team strengths and weaknesses.

Animated Sequences

Time-series animations that show how statistics evolve during games or seasons. These dynamic visualizations can reveal momentum shifts, tactical adjustments, and the impact of specific events on overall performance.

Visualization Tools and Platforms

Statistical charts and graphs

Sports data visualization specialists use a variety of tools ranging from programming languages like Python and R to specialized software like Tableau and Adobe Illustrator. Many share their techniques, code, and design files, creating a collaborative ecosystem where visualization methods continuously improve.

Interactive visualizations have become increasingly popular, allowing users to explore data themselves. Web-based tools using JavaScript libraries like D3.js enable creators to build sophisticated, responsive visualizations that work across devices. These interactive elements engage audiences more deeply than static images, encouraging exploration and discovery.

Competitions and Challenges

Test your analytical skills in prediction contests and visualization challenges

Prediction contest analytics

Prediction Competitions

Prediction contests challenge participants to forecast game outcomes, player performance, or season results using statistical models and analytical techniques. These competitions range from casual bracket challenges to sophisticated modeling competitions that require advanced statistical knowledge.

Many prediction contests provide historical data and evaluation metrics, allowing participants to test different modeling approaches. Successful predictors often share their methodologies, creating learning opportunities for the entire community. These competitions demonstrate the practical application of sports analytics and the challenges of predicting human performance.

Bracket Challenges

Tournament prediction contests where participants forecast playoff outcomes. These challenges often incorporate statistical models, historical trends, and matchup analysis to improve prediction accuracy.

Model Competitions

Advanced contests that evaluate the accuracy of statistical models over entire seasons. Participants develop algorithms that predict game outcomes, player performance, or other statistical measures, with rankings based on prediction accuracy.

Visualization Challenges

Visualization challenges ask participants to create compelling visual representations of sports data. These contests evaluate both analytical insight and design quality, rewarding entries that effectively communicate statistical findings through visual means.

Participants often work with provided datasets or choose their own topics, creating infographics, interactive dashboards, or animated visualizations. Judges evaluate submissions based on clarity, creativity, statistical rigor, and visual appeal. Winners often see their work shared widely across social media and sports analytics communities.

Skill Development

Challenges provide opportunities to practice data visualization techniques, experiment with new tools, and receive feedback from experienced analysts and designers.

Community Recognition

Successful submissions gain visibility within the sports analytics community, often leading to professional opportunities and collaborative projects.

Learning from Others

Reviewing other submissions exposes participants to different approaches, techniques, and perspectives on data visualization and statistical analysis.

Open Data Projects

Access comprehensive datasets for research and analysis

Open data research

The open data movement has transformed sports analytics by making high-quality datasets accessible to everyone. Organizations, leagues, and individual researchers share data that was once proprietary, enabling students, hobbyists, and researchers to conduct meaningful analysis without expensive subscriptions.

Open data projects cover various sports and levels of detail, from basic box score statistics to advanced tracking data. These datasets often include documentation, example analyses, and code repositories that help users understand and work with the data effectively.

Available Dataset Types

Historical Statistics

Comprehensive historical datasets spanning decades of sports history. These collections include player statistics, team performance, game results, and contextual information. Historical data enables long-term trend analysis, era comparisons, and the development of predictive models trained on extensive past performance.

Tracking Data

Advanced datasets that capture player and ball positions throughout games. This spatial data reveals movement patterns, tactical formations, and physical performance metrics. Tracking data has revolutionized sports analytics by enabling analysis of off-ball movement, spacing, and defensive positioning.

Event Data

Detailed logs of in-game events like passes, shots, tackles, and turnovers. Event data includes location information, timestamps, and contextual details that enable sophisticated analysis of game flow, player decision-making, and tactical effectiveness.

Performance Metrics

Physical performance data including speed, distance covered, acceleration, and workload metrics. These datasets help analyze player fitness, fatigue effects, and the physical demands of different positions and playing styles.

How to Use Open Data

Research Projects

Academic researchers use open data to study questions about human performance, decision-making, team dynamics, and the effectiveness of different strategies. Published research often includes code and data, enabling others to verify and build upon findings.

Learning Analytics

Students and aspiring analysts use open datasets to practice statistical techniques, build portfolios, and develop practical skills. Working with real sports data provides motivation and context that makes learning more engaging and relevant.

Tool Development

Developers create applications, visualizations, and analytical tools using open data. These projects range from simple statistical calculators to sophisticated machine learning models and interactive web applications.

Data Journalists and Analysts

Follow leading voices in sports analytics and data journalism

Connect With Us

Have questions or suggestions? We'd love to hear from you

Get In Touch

Mellowhike is committed to fostering connections within the sports statistics community. Whether you have questions about finding the right community, suggestions for resources to include, or feedback about our platform, we're here to help.

Address

5718 1a St SW, Calgary, AB T2H 0E8

Phone

+1 833 393 7625

Response Time

We typically respond within 24-48 hours

Contact us